
How to Read Crypto Charts for Beginners
If you've ever opened a Bitcoin or Ethereum chart and felt totally lost, you're not alone. All those lines, shapes, and colors can be overwhelming — especially if you're just starting out. But don’t worry. In this beginner-friendly guide, you’ll learn how to read a crypto chart step-by-step — using simple examples and visuals.
What Is a Crypto Chart?
A crypto chart shows the price movement of a cryptocurrency over time. It helps traders and investors understand the market's mood, make informed decisions, and spot trends before they happen.
Understanding Candlestick Charts (With Example)
Most crypto charts use candlesticks to show price movement. Each candlestick represents price action within a set time period (like 1 hour, 1 day, etc.).
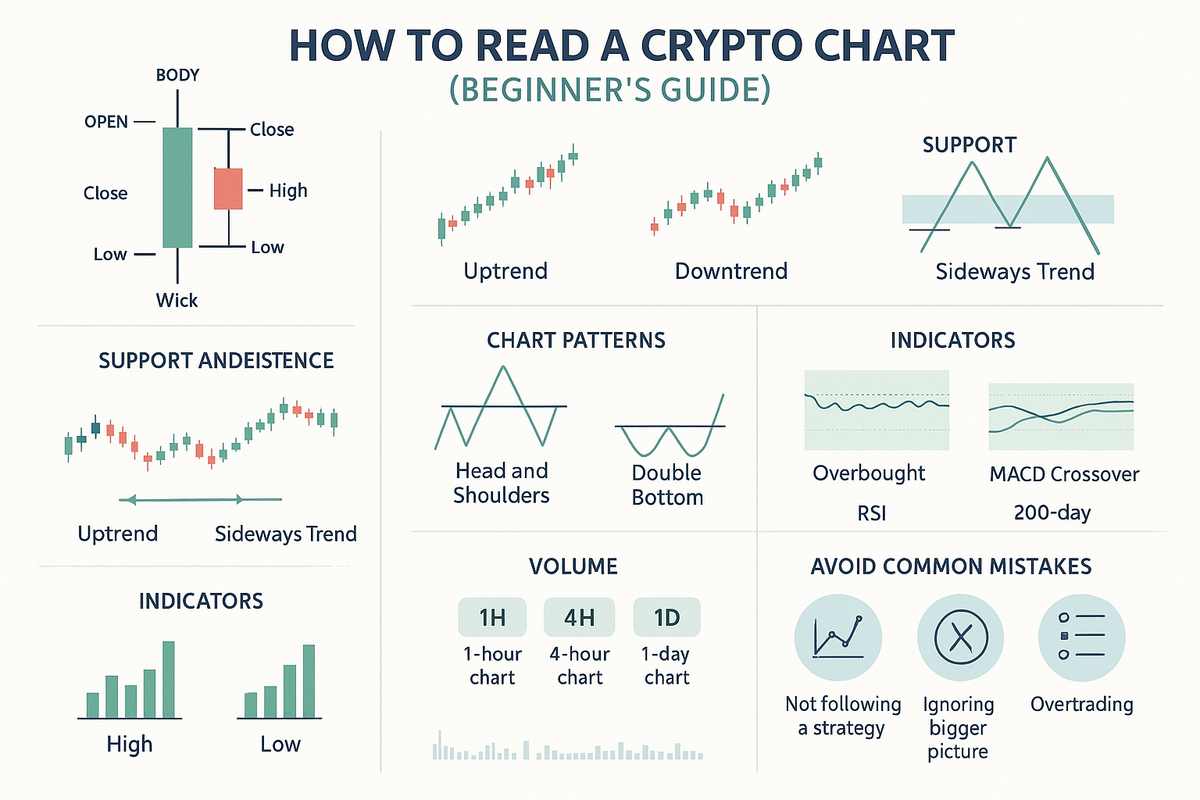
Anatomy of a Candlestick:
- Open: Where the price started during the time frame
- Close: Where the price ended
- Wick (Shadow): The high and low within that time
- Body Color:
- Green (or white): Price went up
- Red (or black): Price went down
🔍 Example:
Let’s say you're looking at a 1-hour candlestick on the BTC/USDT chart:
- Open: $29,000
- Close: $29,500
- High: $29,800
- Low: $28,900
This candlestick would be green because the price closed higher than it opened.
More Guide: How to Avoid FOMO and Make Smart Crypto Investments
Choosing the Right Timeframe
Crypto charts offer different time intervals:
- 1-Minute to 15-Minute: Used for short-term trades
- 1-Hour to 4-Hour: Great for swing traders
- 1-Day or 1-Week: Best for long-term investors
🔍 Example:
A 1-day chart shows long-term trends better. Use this if you plan to hold your investment for weeks or months.
Spotting Trends, Support, and Resistance
📍 What is a Trend?
A trend is the general direction of the price:
- Uptrend: Higher highs and higher lows (bullish)
- Downtrend: Lower highs and lower lows (bearish)
- Sideways: Price moves within a range
🔍 Example:
If Bitcoin rises from $25K to $30K over several days, making higher highs and higher lows, that’s an uptrend.
Support and Resistance
- Support is a price level where buying is strong enough to prevent the price from falling further.
- Resistance is a level where selling pressure prevents the price from rising further.
🔍 Example:
If Ethereum bounces multiple times around $1,700, that’s a support zone. If it keeps getting rejected at $2,000, that’s a resistance.
Volume – The Confirmation Tool
Volume tells you how much of the crypto was traded during a time period. It confirms the strength of a price move.
🔍 Example:
A price breakout from $30,000 to $31,000 with high volume is more trustworthy than the same move with low volume.
More Guide: Lost Everything in Crypto? Not So Fast—Here’s What You Can Still Save
Simple Indicators for Beginners
1. 📏 Moving Averages (MA)
Moving averages help smooth out price data.
- Simple MA (SMA): Equal weight on all data
- Exponential MA (EMA): More weight on recent prices
🔍 Example:
If BTC’s 50-day MA crosses above the 200-day MA, that’s a bullish crossover (Golden Cross).
2. Relative Strength Index (RSI)
RSI tells you if a coin is overbought or oversold:
- Above 70 = Overbought (likely to fall)
- Below 30 = Oversold (likely to rise)
🔍 Example:
If RSI is 82, the coin might be overbought — a correction could be coming.
3. MACD (Moving Average Convergence Divergence)
MACD compares two EMAs to show momentum. It includes:
- MACD Line
- Signal Line
- Histogram
🔍 Example:
If MACD crosses above the signal line, it may signal bullish momentum.
Chart Patterns to Know
These patterns give traders hints about possible future movements.
Head and Shoulders (Reversal)
Triangles (Breakout Potential)
🔍 Example:
A double bottom pattern often signals a reversal from downtrend to uptrend.
Common Mistakes to Avoid
- Relying on one signal only – Combine trend, volume, and indicators.
- Chasing pumps – FOMO leads to bad trades.
- Ignoring timeframes – Match your chart to your trading style.
- Skipping risk management – Always use stop-losses.
Best Free Tools to Use
- TradingView – Most popular charting tool
- CoinMarketCap – Quick overview of crypto prices
- Binance / Bybit / Coinbase Pro – Built-in charts for trading
Final Thoughts: You Can Do This
Learning how to read a crypto chart isn’t as scary as it seems. Start with the basics:
- Recognize candlesticks
- Understand trends
- Spot support and resistance
- Use volume and simple indicators
With practice, the charts will start making sense — and you'll trade or invest with confidence.
1. What is a crypto chart and why is it important for beginners?
A crypto chart visually represents the price movement of a cryptocurrency over time, helping beginners understand trends, market behavior, and make informed trading decisions.
2. How do I read candlestick patterns on a crypto chart?
Candlestick patterns show the opening, closing, high, and low prices within a specific time frame. Green candles indicate upward movement, while red candles show a price drop.
3. What do timeframes like 1D, 1H, or 5M mean in crypto charts?
These timeframes represent the duration each candle covers. For example, 1D means one candle equals one day’s price data, 1H equals one hour, and 5M equals five minutes.
4. What are support and resistance levels in crypto trading charts?
Support is a price level where buying interest is strong enough to prevent a further drop. Resistance is where selling pressure may stop a price from rising further.
5. Which chart indicators should beginners use first?
Beginners should start with simple indicators like Moving Averages (MA), Relative Strength Index (RSI), and Volume to understand trend direction, momentum, and market strength.
Post a Comment